Intro
In this tutorial, I’m going to walk through some examples of using the Audio Metering patch in Origami. This patch allows you to measure the peak volume, current volume, and frequency data or sound wave of an audio source, such as the Microphone patch or the Sound Player patch. This lets you create some really cool visualizations out of recording audio messages, playing music or even building a voice recognition assistant prototype like Siri or Google Voice
Basic Example
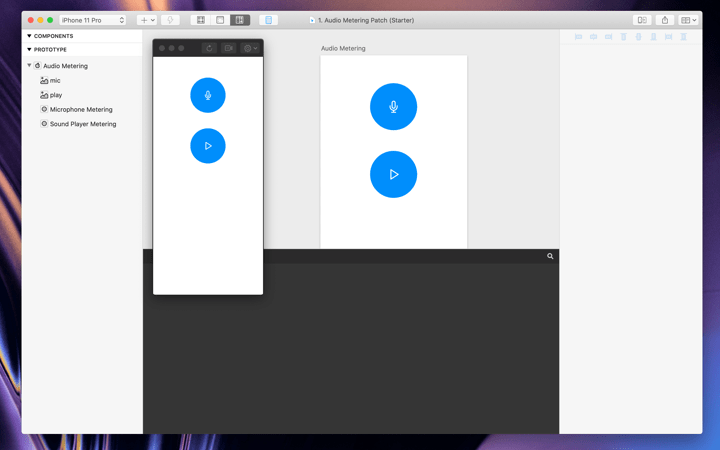
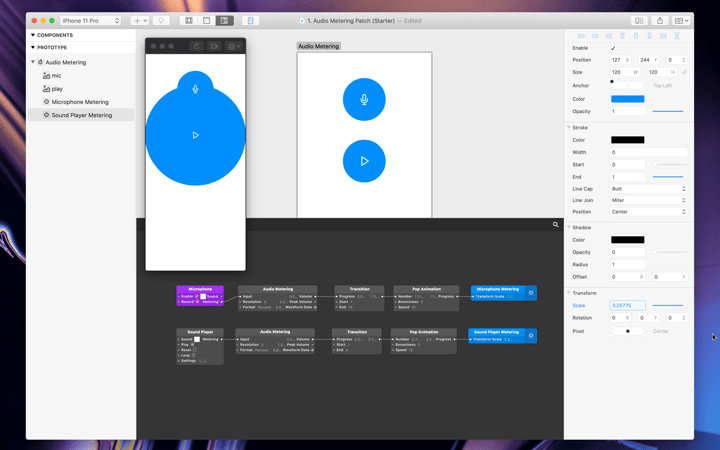
Let’s walk through a basic example of using the Audio Metering patch in Origami. Open the first starter file where you’ll see I have two circles on the canvas already. One that I’ll use for visualizing live audio of my voice using the Microphone patch. And one that I’ll use for visualizing recorded audio from the Sound Player patch.
Microphone
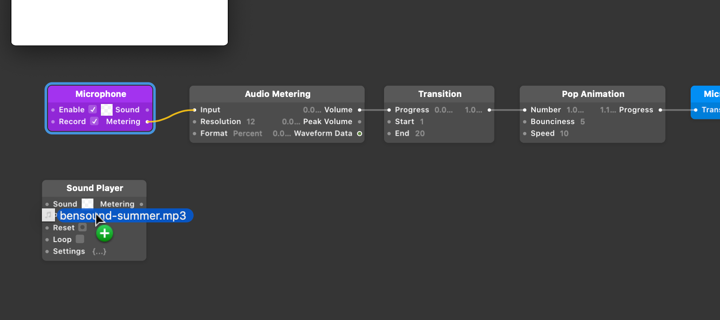
Add a Microphone patch from the patch picker and make sure both enabled and recording are checked. Then insert an audio metering patch.
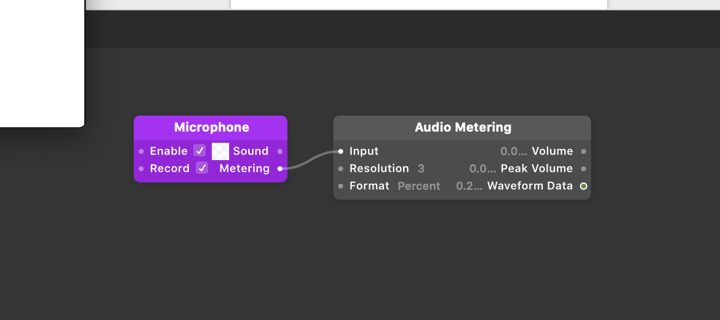
The audio metering patch provides 3 different outputs. Volume, peak volume and waveform data. Volume is the loudness or amplitude of the connected sound or audio. This is the output we’ll be working with the most. The next output is peak volume, this is the highest point of loudness over time from the connected source. So over the course of about a second or so this is the highest that the volume gets. The last output is waveform data which gives us a loop of ranges of an audio source.
We’re going to connect the Microphone patch metering output to the audio metering patch input. You should then start to see some numbers appear for each of the audio metering outputs. Since we have percent selected as our format, the patch will return decimal values from 0 to 1, with 0 being silence and 1 being the loudest sound from the our source.
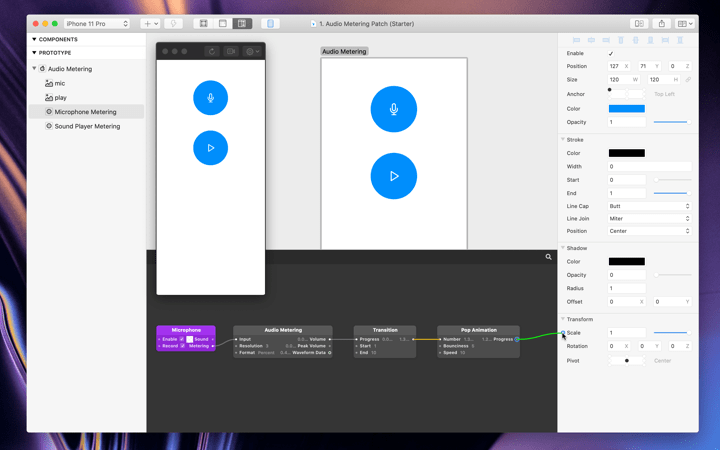
Since we want to animate the scale property of the circle, we need to map the 0 to 1 output to some larger values. We could either multiply the volume x10 using the Multiplication patch or use the Transition patch to take the 0 to 1 values and convert it to a new range like 1 to 10. Let’s go with the transition route. Add a Transition patch and change the start input to 1 and the End input to 10.
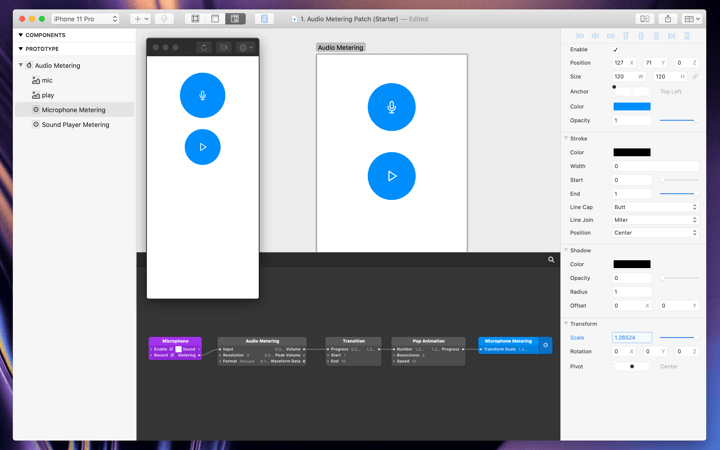
We then want to add a Pop Animation patch to smooth out the changes in volume. We’ll then take this patch graph and connect it to the scale property of the first circle. We should now see the circle animating with the sound of our voice.
We can then play around with this by changing the transition values or the pop animation values.
Sound Player
Similarly we can visualize music from a Sound Player patch the same way. Insert a Sound Player patch. Then drag in an mp3 file.
Select the Audio Metering, Multiplication and Pop Animation patches that we created before. Then Option drag to duplicate them, we’ll be using the same patch graph for our sound player too.
Wire this up with the Sound player and the scale property from the second circle. Now when we set play input to on, we see a similar animation for the music we added.
Waveform
Let’s do one more example, this time with the Waveform data output that I mentioned before. This output gives us a loop of the low, mid, and high ranges of an audio source. Kind of like the audio visualizers used in Winamp or Windows Media Player back in the day. We can take a look at each of the values being returned by the Waveform Data loop by clicking on the patch output.
In Origami anytime a patch output is green, it means that a loop is being returned. So when we connect that loop output to any other patch inputs, Origami is going to apply the logic in those connected patches to each one of the values in that loop. See Introduction to Loops for more on working with Loops.
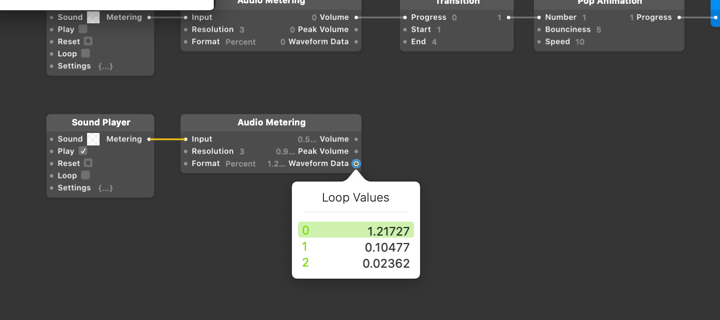
Let’s see what this looks like in practice. We’re going to use the waveform values to set the height of a group of rectangles arranged using layout. Let’s copy our Sound Player patch from before, then insert another Audio Metering patch. Connect the Sound Player metering output to the Audio Metering input. This time we’ll use the waveform data output.
Again since our audio metering patch returns a decimal values from 0 to 1 we need to multiply it into some larger values so we can actually see it show up as the height. So add a multiplication patch and set the multiplication value to 1000. You can use whatevers right for your prototype but in our case 1000 works here. Then connect the waveform data output to the multiplication patch input.
Add a Pop Animation patch so we can smooth out the value transitions and then connect the multiplication patch.
Then we’ll draw a rectangle below the circles on the canvas. And connect the pop animation output to the height property of the rectangle we just drew.
When we try playing our Sound Player you’ll notice we’re still only seeing one sound bar getting animated. That’s because all the rectangle layers getting generated by our loop are stacked on top of each other.
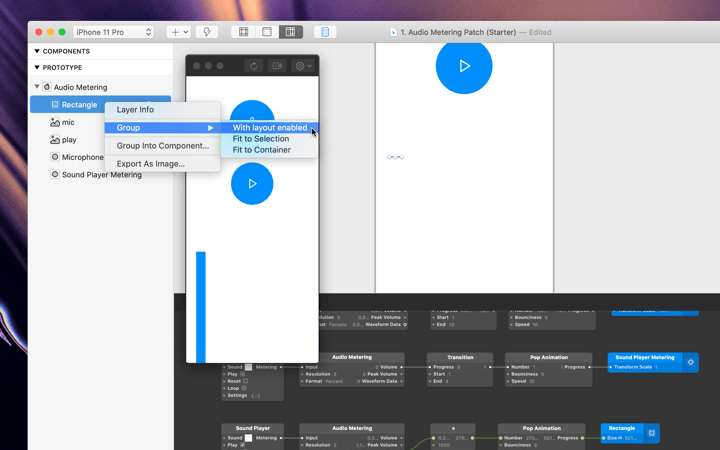
So, what we can do is select our rectangle, right click and select “Group → With Layout Enabled”, and what this will do is create a group that contains our rectangles with layout turned on.
By default, Layout will set the direction to vertical but we want to have our rectangle layers lined up horizontally like an audio equalizer.
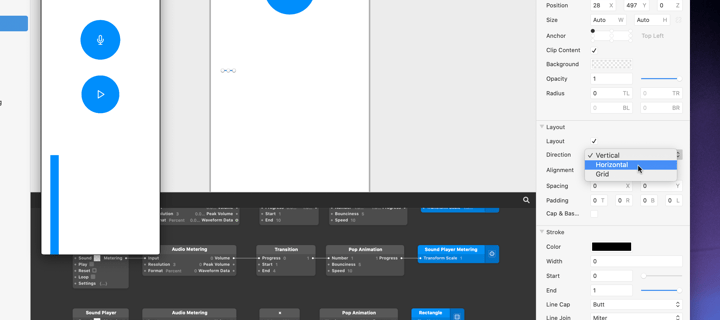
So in the Layout settings for the group, change the direction to horizontal. And let’s also set the X / Horizontal spacing to 8.
Ok, so now the rectangle layers we setup are animating with the audio source but they’re doing this upside down from the direction we want. Because by default the alignment and anchor is set to top left.
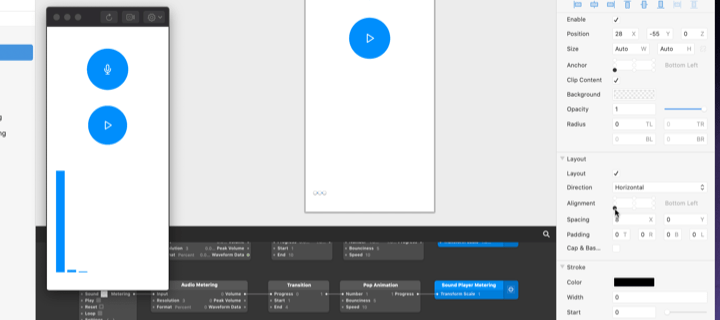
So let’s change those really quick. When we do this our group might move off of our artboard because it’s coordinates are now based on a different anchor point. So let’s drag it back onto the screen.
And there we go, our audio equalizer.
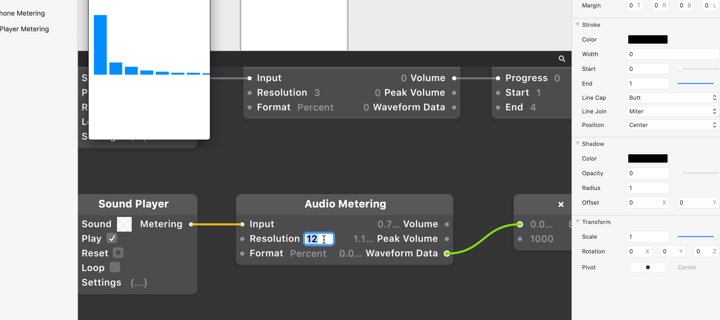
We can also use the Resolution input of the Audio metering patch to control how many range values to return in the loop. Currently it’s returning 3 but we can change this to 12 and we can see our audio ranges are now broken up into 12 values of low, medium and high.
You can already start to imagine how we might use the dynamic variations of waveform data to create a more complex prototype, such as a voice recognition app
Messenger Audio Metering
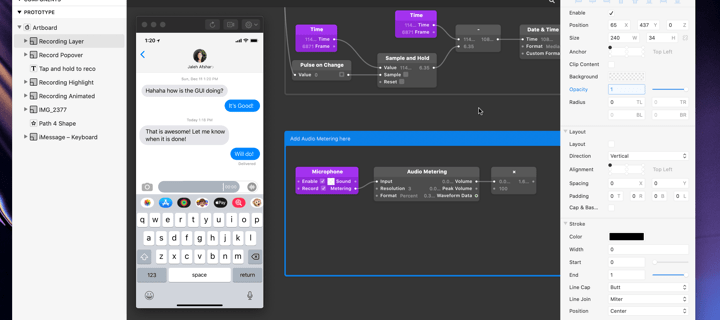
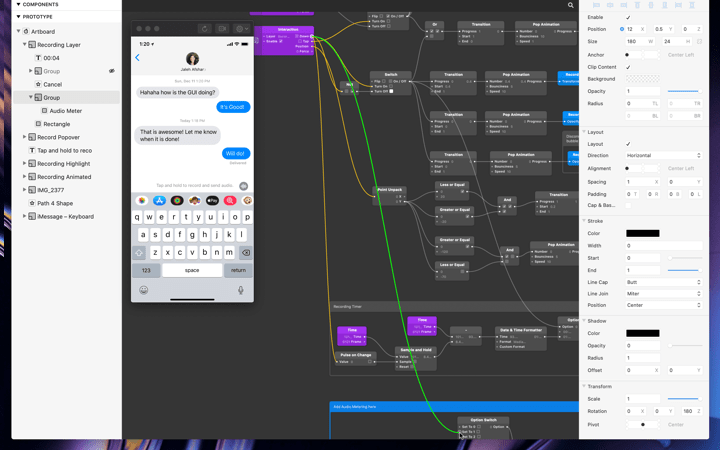
Let’s take a look at some more practical examples. In this example, we’re using the Volume output of the Audio Metering patch to control the scale of this gray circle to indicate that we’re recording.
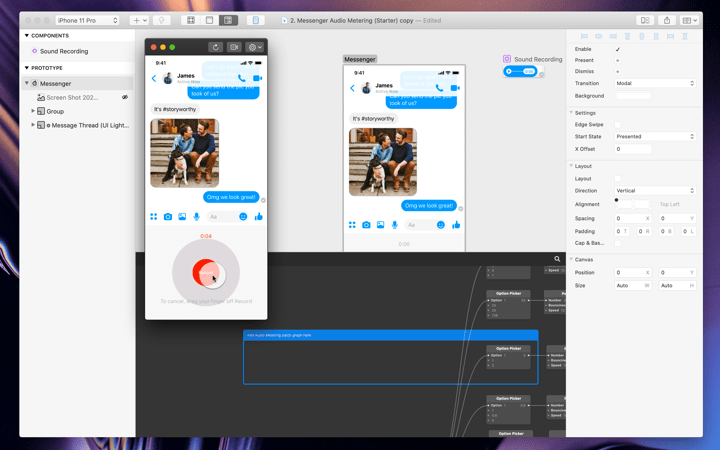
If you open up the second starter file, you’ll notice I’ve already setup the UI layers on the canvas and have the interactions setup already. So now, when we hold down the record button the gray sound volume circle animates in and the recording time starts counting. Then when we release it animates in a new message. Let’s add an Audio Metering patch so we can animate the recording indicator with the sound of our voice.
So, just like we did before. We’re going to insert a Microphone patch. Set recording and enabled to on. Add an audio metering patch. Then add a transition patch. Change the transition start value to 1 and the transition end value to 20.
We’re going to insert our new patch graph into the second option picker value. So when we’re not recording the circles scale remains 1. And when we are recording, the circles scale is set to the audio metering volume.
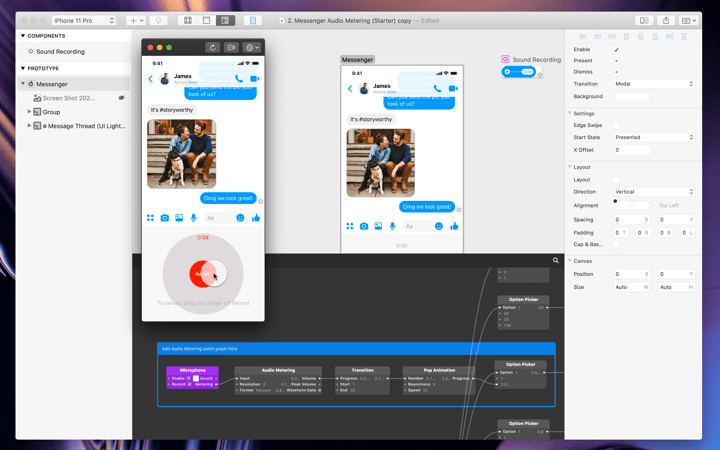
Now with our pop animation already setup try holding record. This is basically the same as our first example, but you can see how we can combine the audio metering patch with other interactions to really bring our prototype to life.
iMessage Audio Metering Over Time
In this example we want to get a wave of the audio volume over time, similar to Soundcloud or iMessage. So what we can do, is we can sample the volume output of the audio metering patch every second or so. Then we can insert that value into a new loop. We can then use that loop to build our wave visual using horizontal layout in canvas, like we did before with the waveform data.
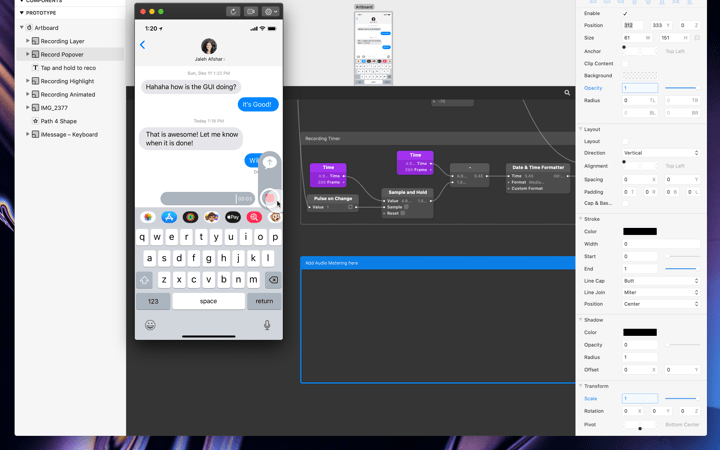
Let’s open up the iMessage starter file. You’ll see I’ve already setup the gray speech bubble to animate in when we hold down record. Let’s setup the sound wave visual to animate while we’re recording.
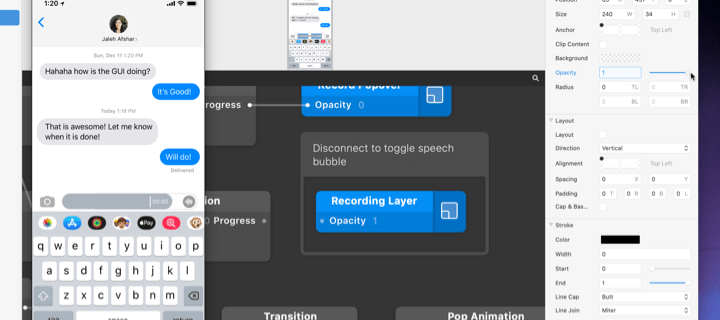
First let’s disconnect our speech bubble layer so it’s easier to see what we’re doing.
Then just like we did before, we’re going to add a Microphone patch, set enable and record to on. Then insert an Audio Metering patch.
Just like before, we’re going to add a multiplication patch and multiply the Volume output by something like 100 so we get a larger value to animate the sound bar height property.
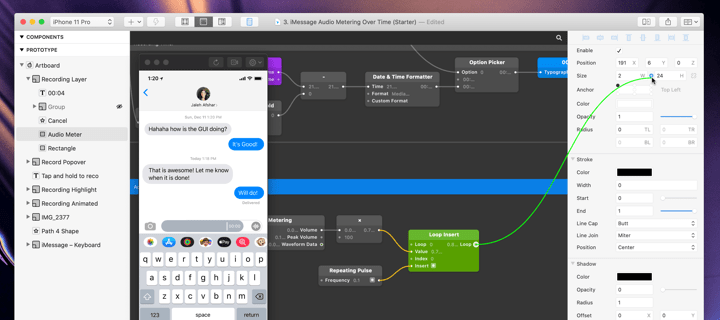
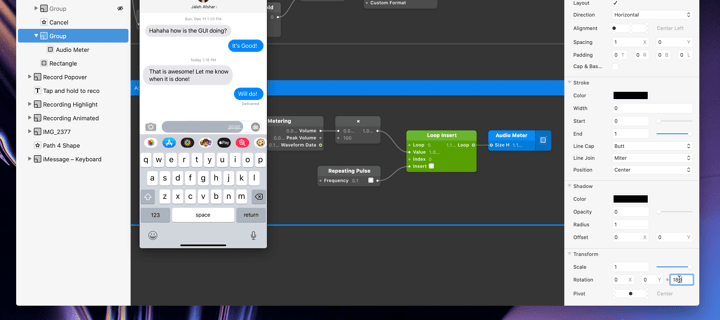
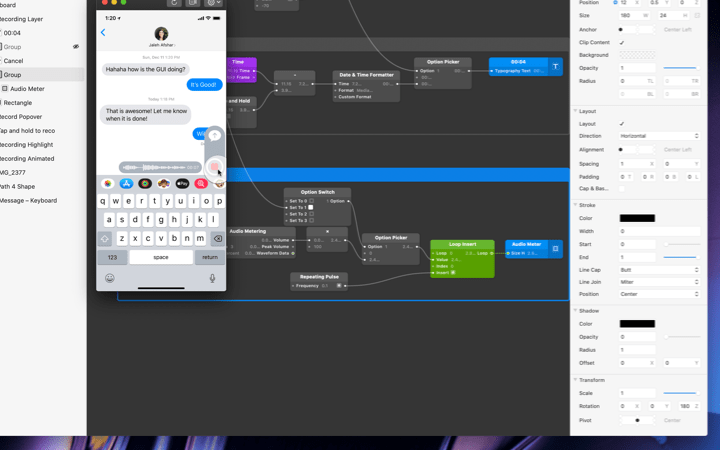
This time, instead of directly connecting the Audio Metering volume output with the layer property, we’re going to add a Loop Insert patch. This is what’s going to build our sound wave visual over time.
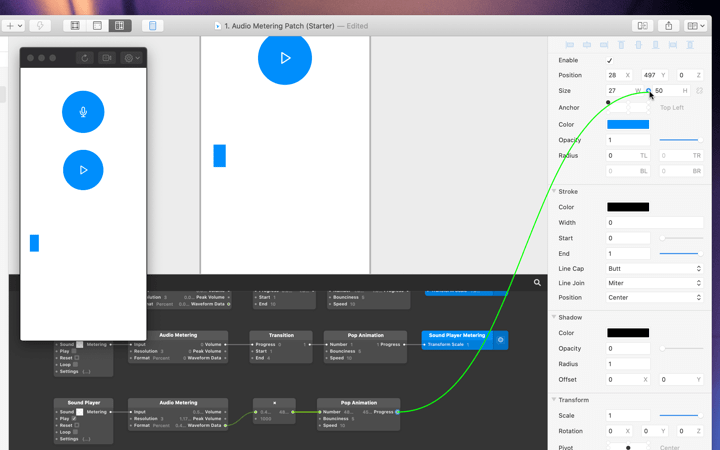
Connect the multiplication patch output to the Loop Insert value input. Then insert a repeating pulse patch and set the Frequency to 0.1 or one tenth of a second. Connect the output of the Repeating Pulse to the Insert input of the Loop Insert patch. Now every one tenth of a second the sound volume gets sampled and added to our new loop. If we click on the Loop output of the Loop Insert patch, we can see our volume sound wave getting created over time.
Let’s connect this patch graph with our layers on the canvas. Take the Loop output and drag it to the height property of the rectangle layer that I’ve already setup called “Audio Meter”.
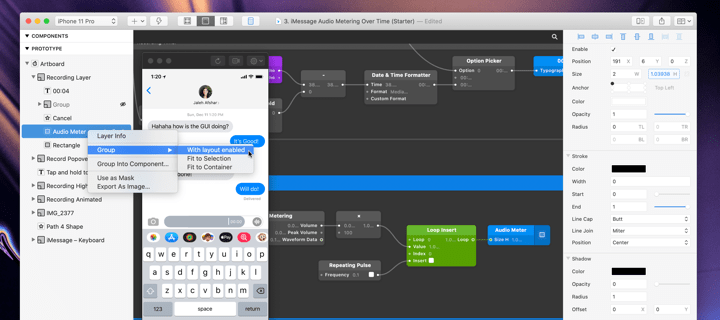
Like with the Waveform example we created earlier, we’re not really going to see anything happening because all the looped layers are still stacked on top of each other. So, the same way we did when we were working with loops before, we’re going to right click on the layer, select “Group → With Layout Enabled”.
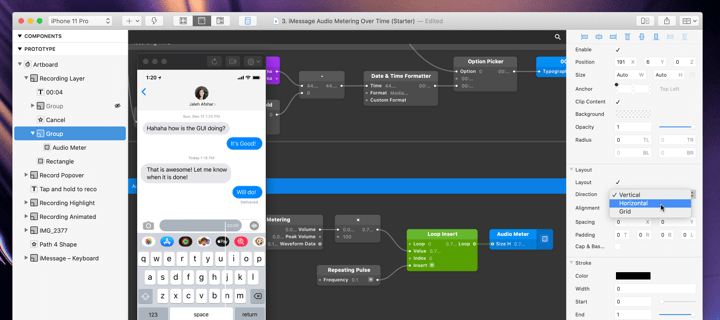
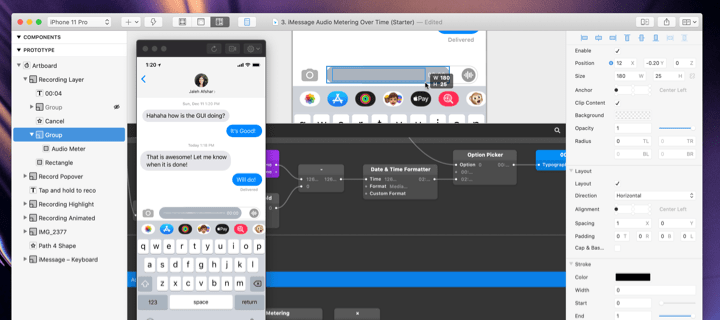
By default the layout direction is set to vertical. In the properties panel for the group, change the Direction to Horizontal. And add some spacing in between. Then we’re going to set the Alignment to Center Left.
Our wave form animation is starting to come together. If you look at the final example though. The sound wave is animating in the opposite direction, from right to left. The easiest way to change this is simply by rotating it the other direction. In the properties panel for the group set the Z rotation property to 180.
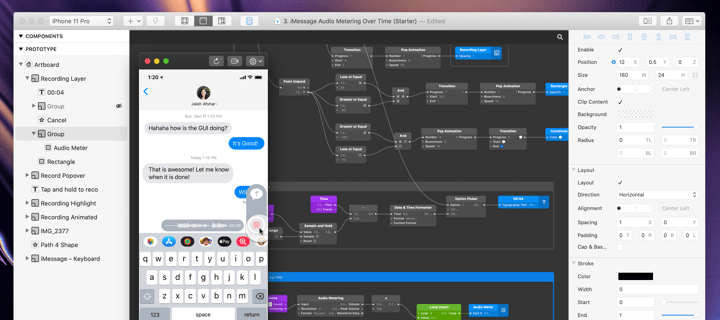
The position and size of the Group layer that contains our sound wave layers is also a bit messed up. Let’s fix this really quick. Bring up the canvas and reposition the group.
Then go ahead and reconnect the transition for the speech bubble layer.
Another thing you may have noticed, is that the sound wave animation is already running before we animate in the speech bubble.
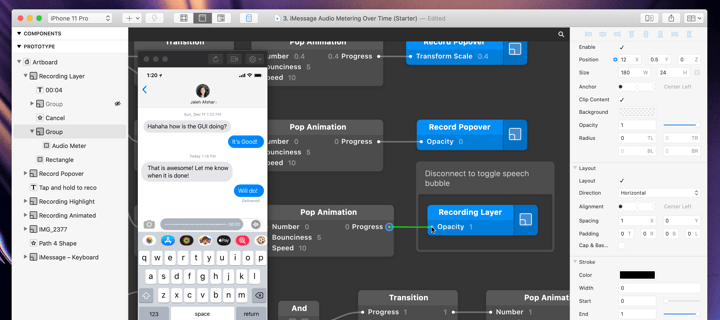
Let’s change this by putting an option switch and an option picker in between the repeating pulse and the loop insert patches.
Insert an option switch and an option picker. Have the first option set to 0, and the second option set to the output of our multiplied audio metering volume.
Then we’ll connect the option picker with the hold recording interaction that I’ve already setup in the starter file. This way our sound wave doesn’t start getting generated until we hold down record.
And there we have it.
I hope this tutorial has been a helpful starting point for working with the Audio Metering patch and given you some inspiration for how to incorporate it into your own prototypes.
The third party designs appearing on this website are the intellectual property of their respective owners. Royalty Free Music from Bensound